


95 Million Acres of Corn in 2025! Iowa Realtors Land Survey; Emergency Commodity Assistance Program
Corn Belt Newsletter for March 2025

Notable Land Sales Video: Check out the video above for notable land sales from Iowa for February!
Acreage and Quarterly Stock Numbers: The newsletter is coming out a few days late due to the Acreage and Quarterly stock reports that dropped yesterday. Not surprisingly, corn acreage is projected to increase by 4 million acres from last year. This is due to the current unprofitability of soybeans as well as good demand for corn. Projected soybean acreage is 83 million acres—a drop from 87 million a year ago. Corn was about 1 million acres above expectation. Grain stocks came in as expected. Interestingly, there was more corn used from December to February than at any other time in history. Lower corn prices were a main factor, as well as good demand. Exports for soybeans will start to slow down due to Brazil’s harvest. The Grain Stocks report confirms January’s big yield drop in soybeans to 50.7 bushels per acre. Keep in mind, we will have a better acreage number for both crops at the end of June.
Link: Grain Stocks
Link: Prospective Plantings
Emergency Commodity Assistance Program: The USDA released guidance for the Emergency Commodity Assistance Program (ECAP). This program will give direct payments to commodity growers around the country. Iowa farmers are expected to receive around $846 million in payments. Corn growers will receive $42.91 an acre and soybean growers will receive $29.76 an acre. How will this influx of cash affect the land market going forward? Time will tell. Check out the link below for more details on the program.
Iowa Realtors Land Survey: The Iowa Realtors Land Institute released its spring survey on Iowa land values. The survey said, “The results of the March survey show a 1.0% decrease on a statewide average for the September 2024 to March 2025 time period.” The survey also showed that farmland has decreased by 6% over the past year. Most people surveyed said that they see the land market in a holding pattern. Tariffs are on everyone's mind. How they will affect the land market in the days and weeks ahead remains to be seen. Watch this space.

Link: Land Trends and Values Survey
Link: Emergency Commodity Assistance Program (ECAP)
Link: Breaking Down $10 billion in Economic Aid: Who Gets What?
Tariff Study: Given the ongoing discussion of tariffs, I will continue to link to the study done by the National Corn Growers Association and the American Soybean Association. They did a great job explaining the intricacies of tariffs and their effect on the agricultural economy.
Link: Tariff Study
Farmland Sales: Below are a few notable farmland sales from February.
77 acres sold in Sioux County, IA. The farm had a CSR-2 rating of 91 and sold for $17,200 per acre, or $189 per CSR-2 point.
160 acres sold in Fayette County, IA. The farm had a CSR-2 rating of 84 and sold for $11,491 per acre, or $136 per CSR-2 point.
160 acres sold in Calhoun County, IA. The farm had a CSR-2 rating of 87 and sold for $13,300 per acre, or $152 per CSR-2 point.
Link: Corn Suitability Rating (CSR-2) Explainer
Check out the rest of the newsletter for important indicators that affect the land market and agriculture.
Commodity Markets
Corn:
Feed and Residual Use: USDA’s latest estimates remain unchanged from their previous report. 5.775 billion bushels of feed and residual use is predicted for the 2024-2025 marketing year.
Why it Matters: Feed and residual demand account for about 40% of corn usage. With cattle prices at near-record levels, feed demand should remain steady.
Ethanol: In 2024, ethanol demand was 5.478 billion bushels. Recent USDA estimates kept those projections for the 2024-2025 marketing year unchanged at 5.5 billion bushels.
Why it Matters: Ethanol makes up roughly 40% of corn usage. Keep an eye out for tariffs on Canada. They are the biggest buyer of U.S. ethanol.
Exports: Projections for corn exports were 2.450 billion bushels for the 2024-2025 marketing year. USDA’s latest estimate was unchanged from the previous report of 2.450 billion bushels for export in 2024-2025.
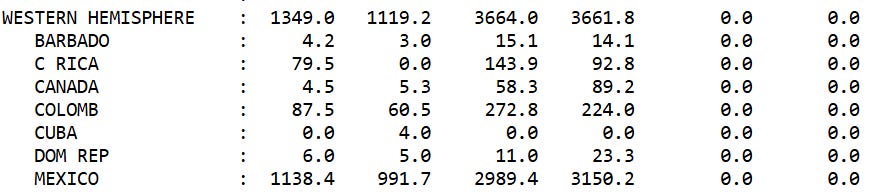
Why it Matters: Exports comprise about 20% of U.S. corn demand. The U.S. is about 300 million bushels of shipped exports ahead of last year. Southeast Asia has been a big buyer recently, and Mexico remains our biggest buyer. See the chart below.

Link: WASDE
Link: Exports
Soybeans:
Crush: The National Oilseed Processors Association (NOPA) crush data for February was 177 million bushels, down from 187 million bushels a year ago.
Why it matters: Roughly 50% of U.S. soybeans are used for crush and oil production. Uncertainty around biofuel policy has dragged on crush numbers recently.
Exports: The USDA’s recent export projections showed that 1.825 billion bushels of soybeans were estimated for export during the 2024-2025 marketing year. Unchanged from the previous report.
Why it matters: About 50% of our U.S. soybean crop is exported. Keep an eye on tariffs. We will see how they impact sales of U.S. soybeans going forward. As of now, soybean exports look good. Last week, Mexico was our biggest buyer. See the chart below.
Link: WASDE
Link: Exports
Commodity Futures Trading Commission: The Commodity Futures Trading Commission (CFTC) shows that managed money has a long position in the corn market and a short position in the soybean market. Long corn contracts of (73,920) and short soybean contracts (33,821).
Why it matters: The funds influence the commodity markets, so we examine their positions each month. They have reduced their long positions in the corn market by a significant margin over the last month. This has put some negative pressure on the corn market. May corn is currently at $4.61 per bushel, and May soybeans are at $10.34 per bushel.


Link: CFTC
Interest Rates: The sources I am talking to say yearly operating notes range between 7.0% and 8.0%. Last year, they ranged between 8% and 9%.
30-year mortgage rate: The current 30-year mortgage rate is 6.5%, compared to 6.7% a year ago.
Why it matters: Interest rates are a major factor in agriculture. Continue to watch what the Federal Reserve does in the coming months. They are planning on cutting interest rates two more times in 2025. However, uncertainties around inflation and tariffs could change this.
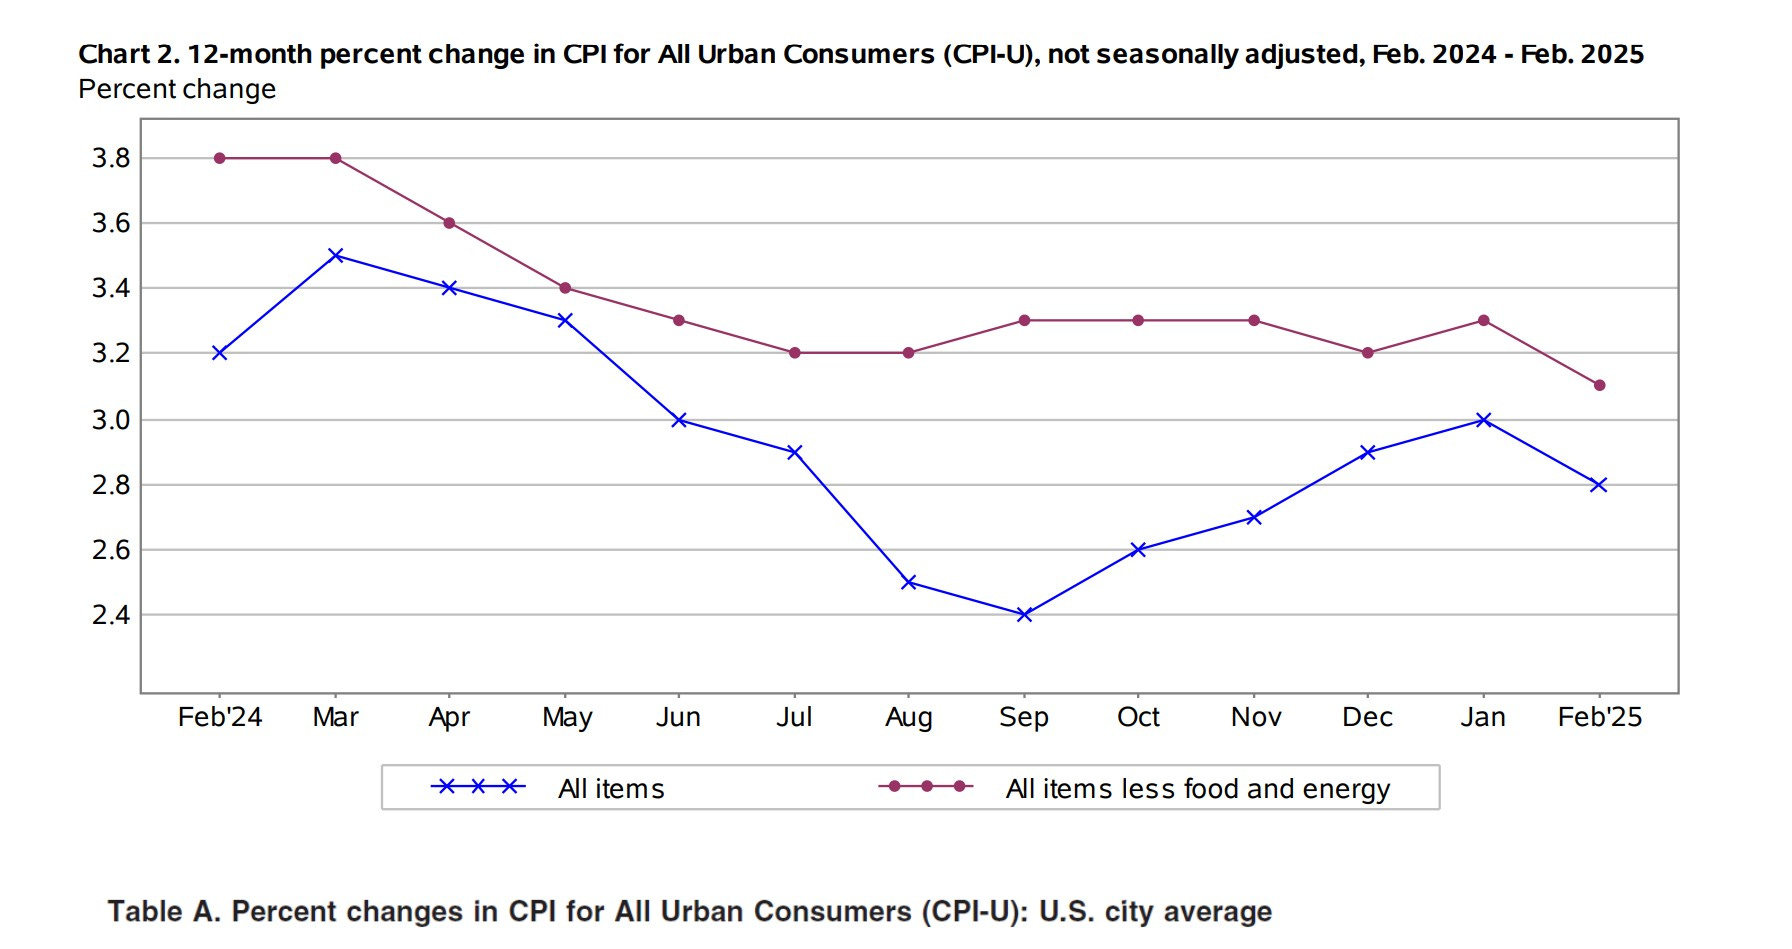
Inflation: The Labor Department's monthly Consumer Price Index (CPI) showed a 2.8% year-over-year increase in its latest report.
Why it matters: This recent data could make the Federal Reserve rethink its plan to reduce interest rates this year as it fears reigniting inflation.
Link: CPI
Link: Federal Reserve sees tariffs raising inflation this year, keeps key rate unchanged
Fertilizer Prices: According to the USDA Production Cost Report, Anhydrous Ammonia (NH3) averages $783 per ton. A year ago, it was $798 per ton. Potash averages $463 per ton. A year ago, it was $521 per ton. Phosphate (MAP) averages $774 per ton. A year ago, it was $771 per ton.
Why it matters: Continue to pay close attention to the tariffs on Canada. We import a majority of our Potash from them. This could increase the cost of production for farmers across the country in 2025.
LINK: Illinois Production Cost
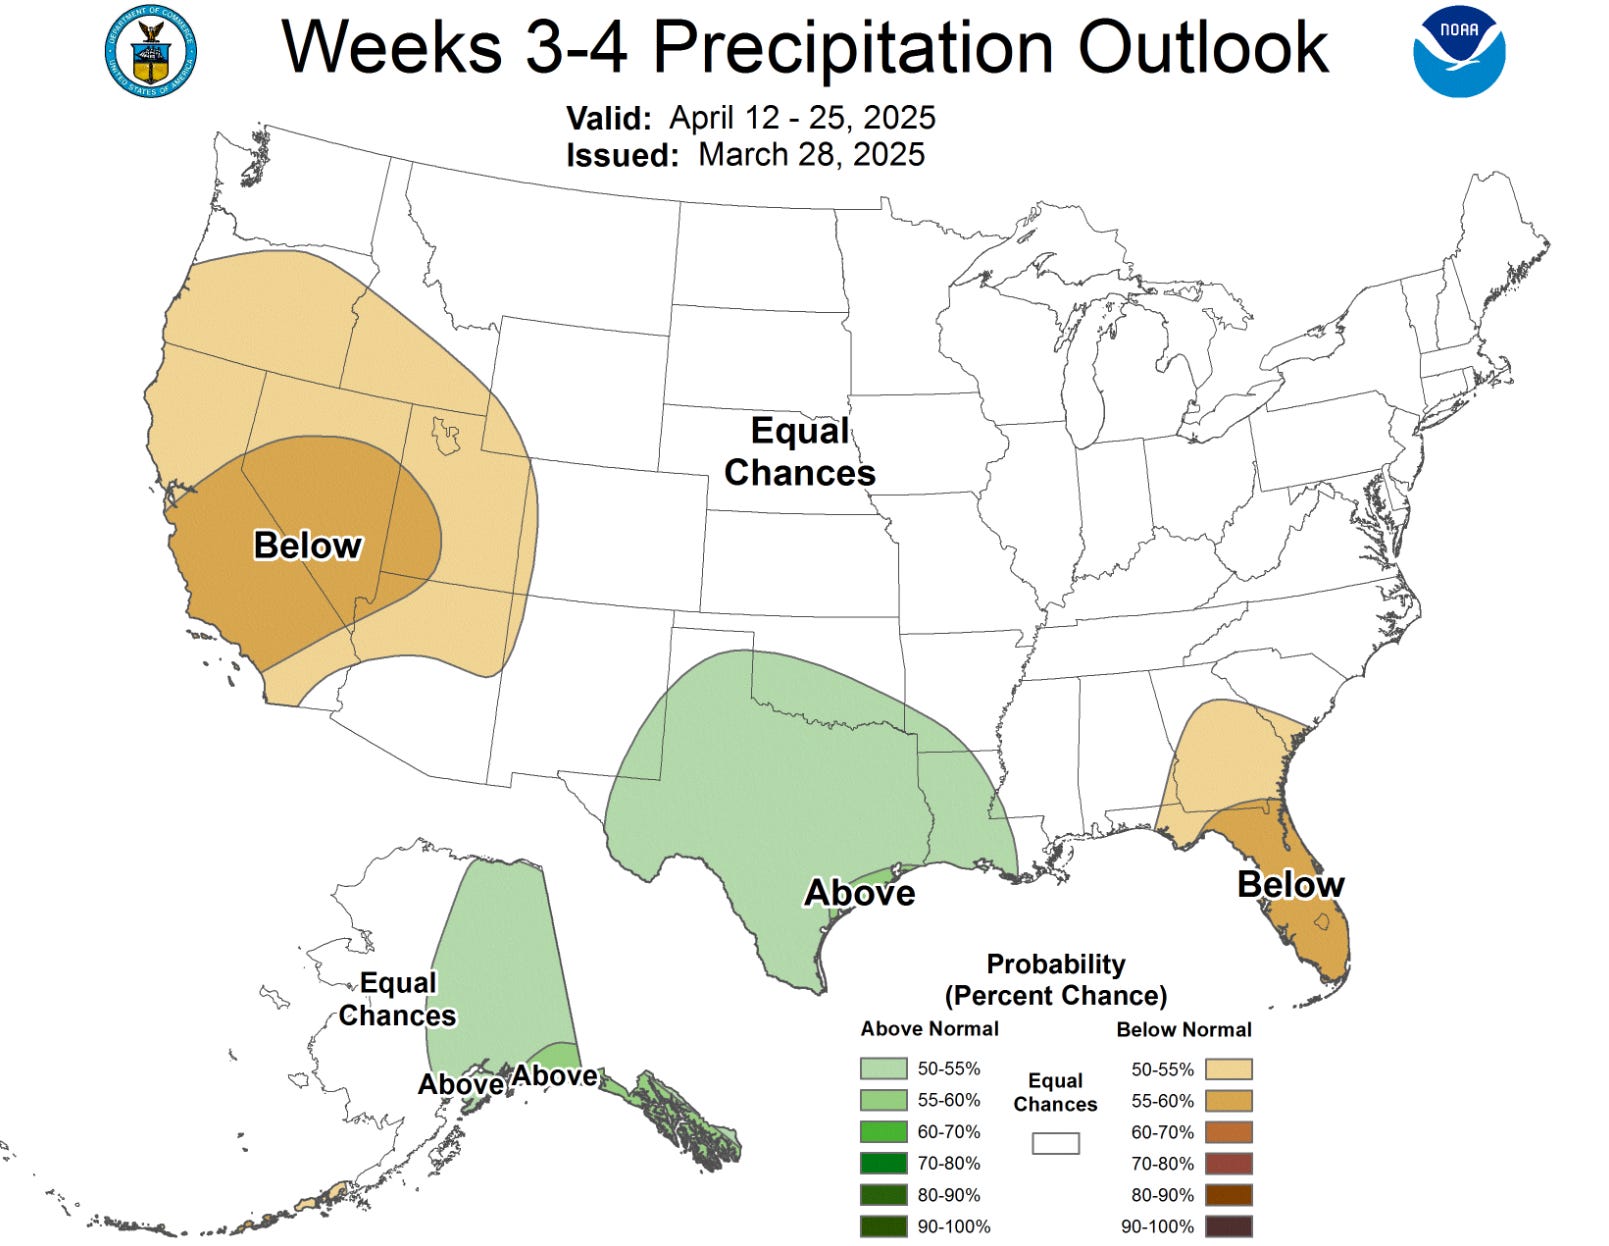
U.S. Weather: Spring planting will commence in a few weeks. As you can see on the Drought Monitor, most of the western corn belt is heading into spring very dry.
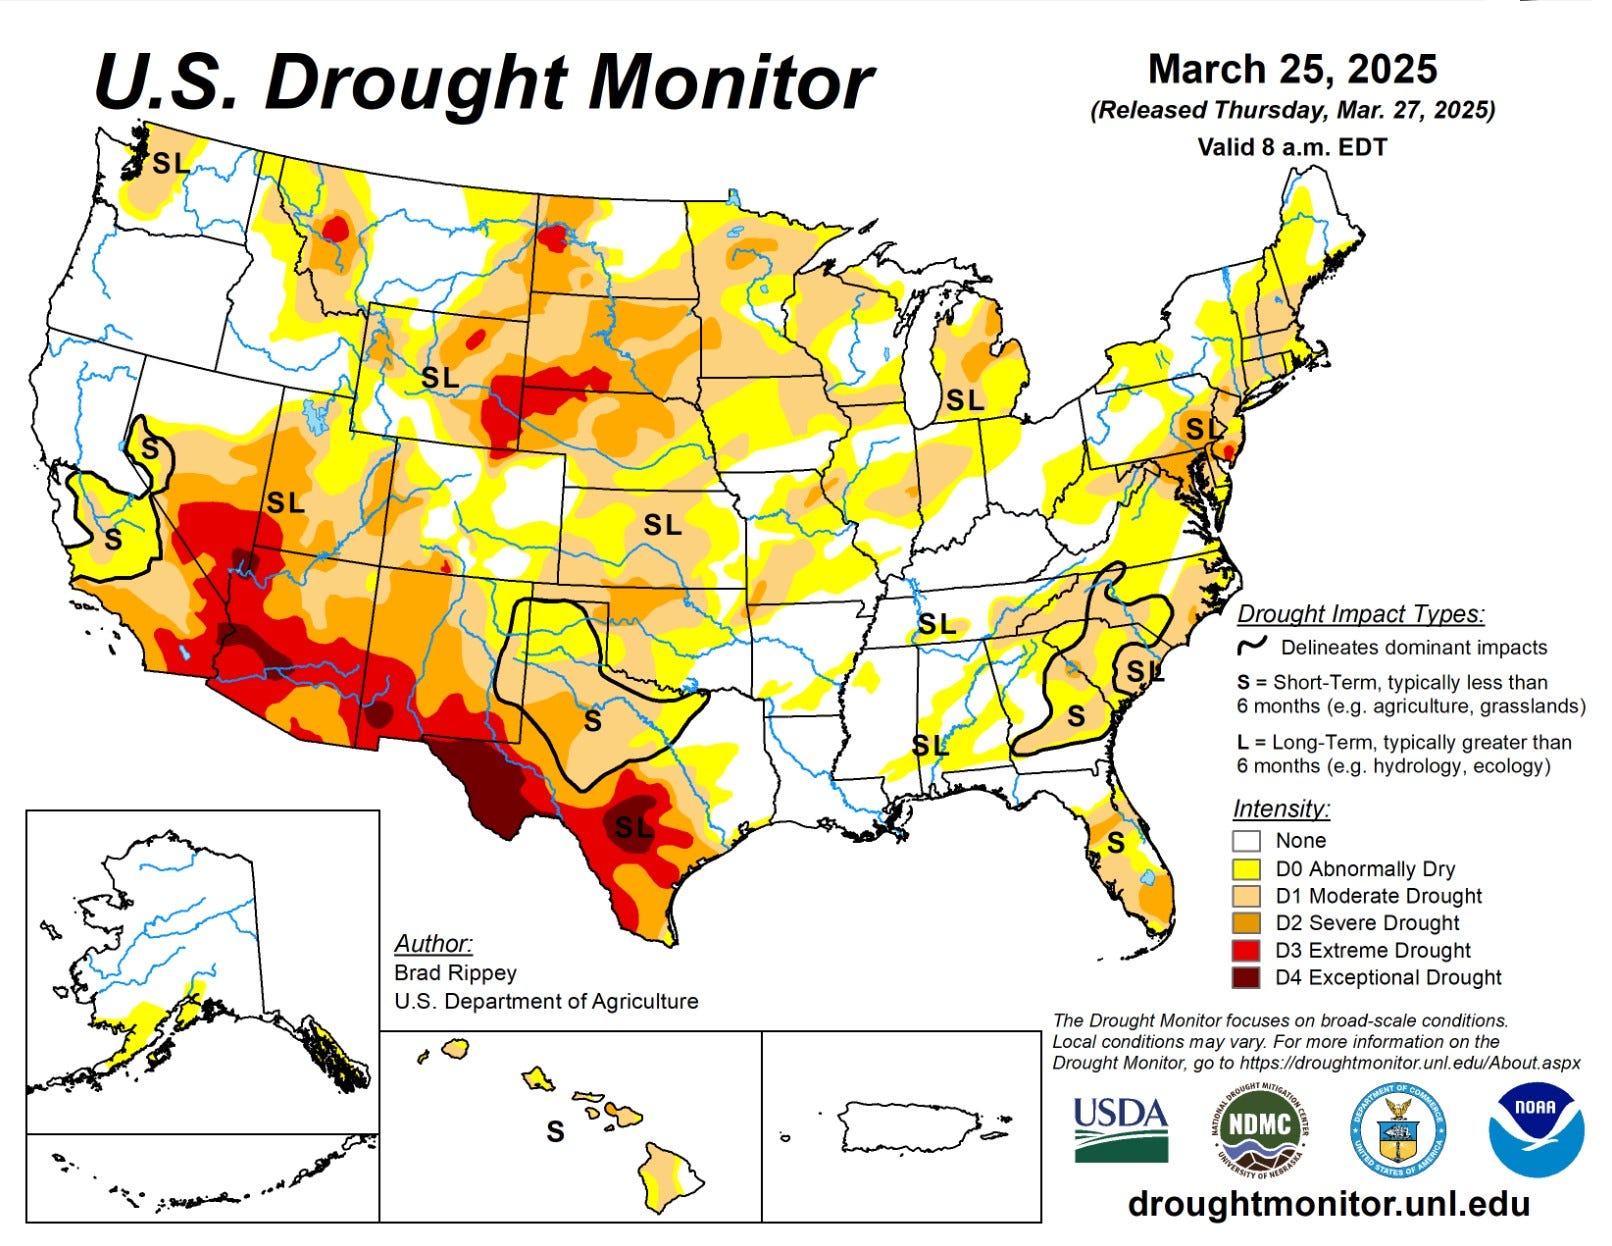
Link: Drought Monitor
Link: Climate Prediction Center
Agriculture News of Note:
Thanks for reading the Corn Belt Newsletter! If you’re looking to buy or sell a farm or want an evaluation of your property, reach out to me.
Contact information: Joshua Manske (Farm Realtor)
Cell: 515-707-1774
Email: joshuahmanske@gmail.com
Farm and Home Services LLC
Excellent newsletter. Very informative.